
Community comparison
Provider market boundaries group historical transactions. They can differ from municipal neighbourhoods, postal areas and the names used in builder marketing. An all-types median changes with the mix of homes sold.
BC · COMPARE THE SETTING
Compare 27 provider-defined community markets and the surroundings of named new-home projects. Explore resale context, nearby amenities and address-specific location observations before choosing a shortlist.
Explore Surrey new homes ↗Surrey’s official community guide distinguishes Cloverdale, Fleetwood, Guildford, Newton, South Surrey and Whalley / City Centre. Start with those settings, then narrow the search to a project address. A citywide presale price or resale median can hide substantial differences between home types and locations.
Provider market boundaries group historical transactions. They can differ from municipal neighbourhoods, postal areas and the names used in builder marketing. An all-types median changes with the mix of homes sold.
Local Logic scores, places and demographics are tied to a named project reference. They are not city averages or proof that the entire surrounding community has the same characteristics.
Check the complete journey to everyday destinations, confirm school eligibility with the relevant board, and visit at the times that matter to you.
PUT THE LOCAL OBSERVATIONS SIDE BY SIDE
Search by name, sort the available observations and select up to three communities. A lower all-types median can reflect different home types and sizes; it does not establish that an area offers better value.
27 matching communities · select up to three to compare. Price and rental medians require five transactions in the relevant category.
| Compare | Community | Median sold | Sales | Active listings | Median rent | Recorded rentals |
|---|---|---|---|---|---|---|
| Bear Creek Green Timbers ↗ | $1,035,000 | 8 | 145 | Unavailable | 2 | |
| Bolivar Heights ↗ | $1,037,500 | 11 | 116 | Unavailable | 3 | |
| Bridgeview ↗Limited sample or history | Unavailable | 1 | 40 | Unavailable | 0 | |
| Cedar Hills ↗ | $1,025,000 | 9 | 75 | Unavailable | 2 | |
| Clayton ↗ | $800,000 | 32 | 142 | Unavailable | 1 | |
| Cloverdale BC ↗ | $1,060,000 | 40 | 278 | Unavailable | 3 | |
| Crescent Bch Ocean Pk. ↗ | $1,540,000 | 8 | 124 | Unavailable | 1 | |
| East Newton ↗ | $855,000 | 19 | 249 | Unavailable | 2 | |
| Elgin Chantrell ↗ | $2,135,000 | 10 | 98 | Unavailable | 0 | |
| Fleetwood Tynehead ↗ | $860,000 | 31 | 299 | Unavailable | 3 | |
| Fraser Heights ↗ | $1,455,000 | 9 | 124 | Unavailable | 1 | |
| Grandview Surrey ↗ | $887,450 | 30 | 257 | Unavailable | 2 | |
| Guildford ↗ | $535,000 | 14 | 214 | Unavailable | 1 | |
| Hazelmere ↗Limited sample or history | Unavailable | 3 | 30 | Unavailable | 0 | |
| King George Corridor ↗ | $650,000 | 39 | 255 | Unavailable | 1 | |
| Morgan Creek ↗ | $805,000 | 14 | 88 | Unavailable | 1 | |
| Pacific Douglas ↗ | $1,244,000 | 10 | 79 | Unavailable | 1 | |
| Panorama Ridge ↗ | $1,071,757 | 11 | 144 | Unavailable | 0 | |
| Port Kells ↗Limited sample or history | Unavailable | 0 | 28 | Unavailable | 0 | |
| Queen Mary Park Surrey ↗ | $675,000 | 10 | 168 | Unavailable | 1 | |
| Royal Heights ↗Limited sample or history | Unavailable | 2 | 25 | Unavailable | 0 | |
| Serpentine ↗Limited sample or history | Unavailable | 1 | 14 | Unavailable | 0 | |
| Sullivan Station ↗ | $780,000 | 16 | 228 | Unavailable | 1 | |
| Sunnyside Park Surrey ↗ | $977,500 | 12 | 73 | $2,400 | 5 | |
| West Newton ↗ | $975,000 | 28 | 214 | Unavailable | 1 | |
| Whalley ↗ | $415,000 | 40 | 747 | $1,800 | 17 | |
| White Rock ↗Limited sample or history | Unavailable | 0 | 12 | Unavailable | 1 |
HouseSigma supplied aggregate export, captured October 24, 2026. All property types; September completed-month observations. Geography IDs remain distinct, including similarly named areas. No builder project is assigned to one of these communities by a name match or proximity guess.
ADDRESS-SPECIFIC REFERENCES
These examples come from recorded project locations, with preference for a second distinct point when available. They are not a ranking or a representative sample of the city. Recorded addresses can be sales or presentation references; known sales-address exceptions are excluded from these examples. Confirm the development site and individual lot or entrance before relying on local information.
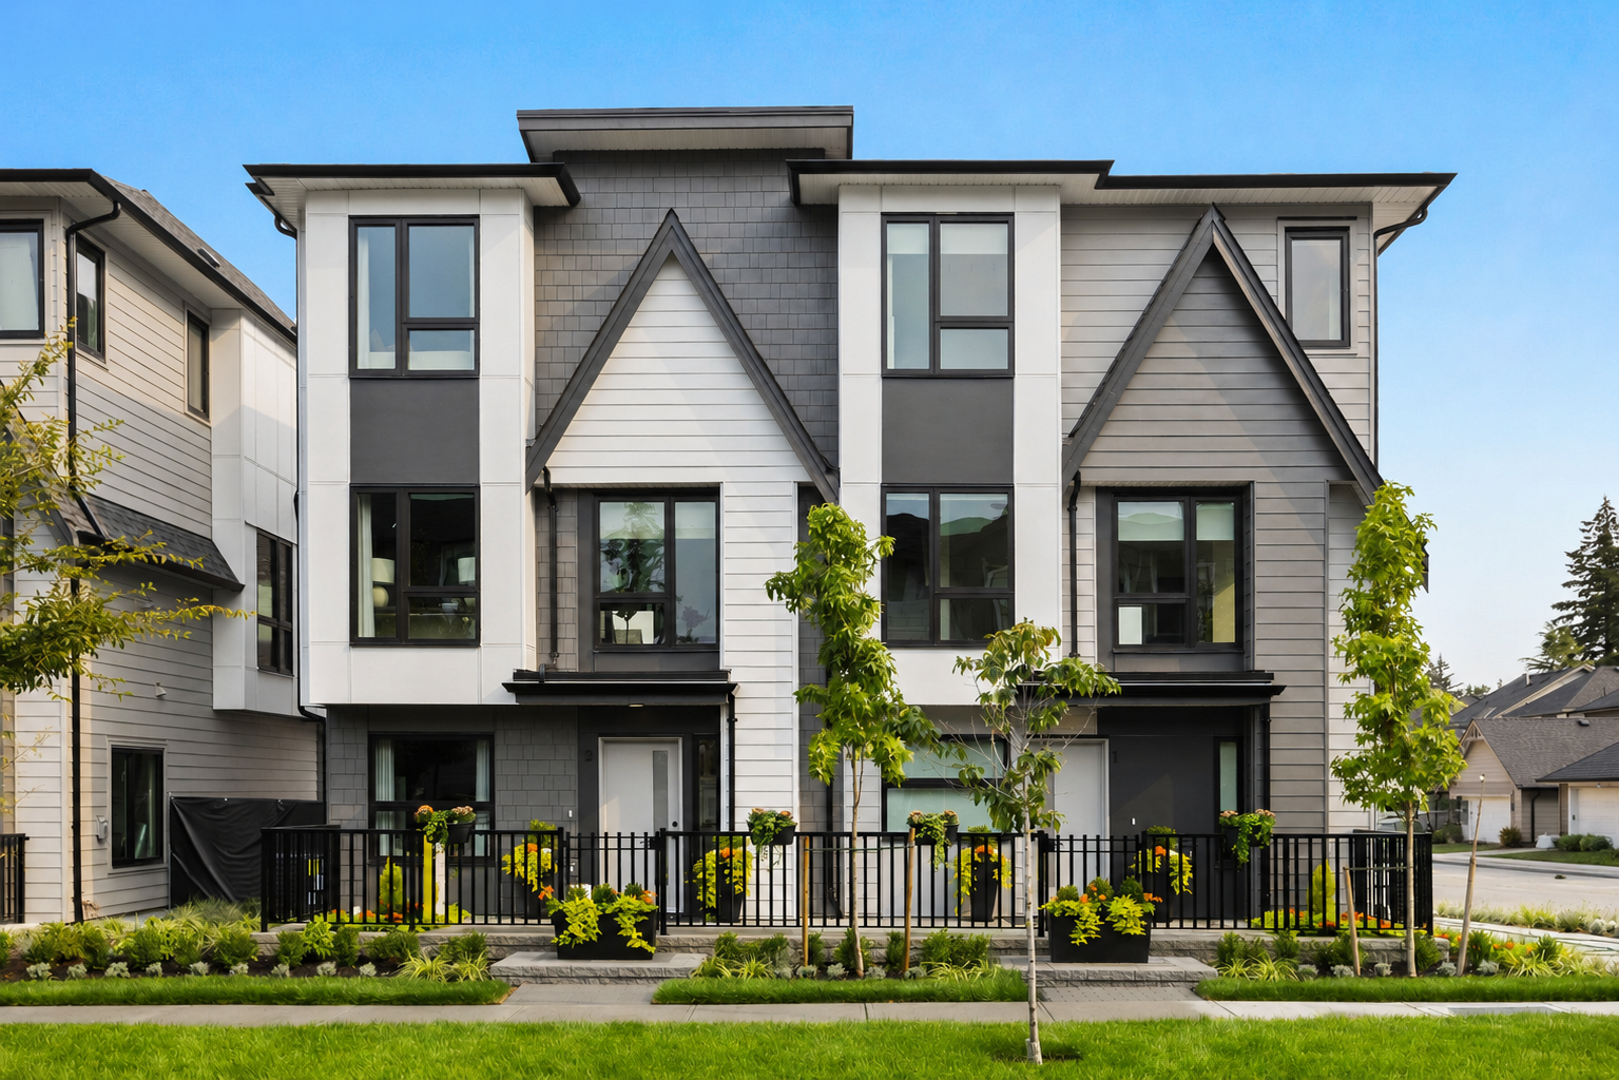
PROJECT LOCATION EXAMPLE
16765 25 Ave, Surrey, BC V3Z 0B1, Canada
Local Logic area label: Grandview. This label is not a verified match to a HouseSigma community.
Recorded reference: 49.04774339999999, -122.7580526
Provider demographic study area: approximately 400 metres around the reference. Underlying census periods may be older and vary by field; this is not a city or whole-neighbourhood total.
Provider demographic study area: approximately 400 metres around the reference. Underlying census periods may be older and vary by field; this is not a city or whole-neighbourhood total.

PROJECT LOCATION EXAMPLE
13722 Larner Rd, Surrey, BC V3R 5K5, Canada
Local Logic area label: City Centre. This label is not a verified match to a HouseSigma community.
Recorded reference: 49.200488, -122.8425201
Provider demographic study area: approximately 400 metres around the reference. Underlying census periods may be older and vary by field; this is not a city or whole-neighbourhood total.
Provider demographic study area: approximately 400 metres around the reference. Underlying census periods may be older and vary by field; this is not a city or whole-neighbourhood total.
Local Logic requests are cached for up to 24 hours; underlying records can be older. Amenity queries use a 2.5 km radius, while schools retain provider coverage. Distances are straight-line, not walking routes or travel times. School proximity does not establish admission eligibility.
A SEPARATE RESALE REFERENCE
Compare the matching home and ownership type. These Sep 2026 resale medians describe completed transactions across the provider’s Surrey geography; they are separate from the recorded builder starting prices above.
95 recorded sales · 1119 active listings
-11.7% annual median change0 recorded sales · 5 active listings
Annual median change unavailable125 recorded sales · 932 active listings
-6.2% annual median change172 recorded sales · 1903 active listings
-7.1% annual median changeHouseSigma supplied aggregate export, captured October 24, 2026. Prices and annual comparisons require five sales in each comparison month. Medians reflect the mix of homes sold; they do not establish appreciation, builder discounts or a future closing value. Read the methodology ↗
TURN RESEARCH INTO A USEFUL VISIT
Prepared independently by Team Arora. New-construction catalogue information comes from the saved October 12, 2026 refresh. Local Logic supplies address-based scores, area labels, nearby-place records and demographic data where available. HouseSigma aggregate exports supply separate community resale observations through September 2026. These providers use different geographies and time periods.
We do not average project-point scores into a city score, claim that a project belongs to a market community from its name, or turn historical resale medians into a builder price forecast. Missing observations remain unavailable. Confirm current services, routes, school boundaries and contract information with the relevant source.